

- Tron gains 5.68% in the last 90 days; Yet Miles behind the Monthly High
- It may find the next halt at the resistance point of 0.0168 USD
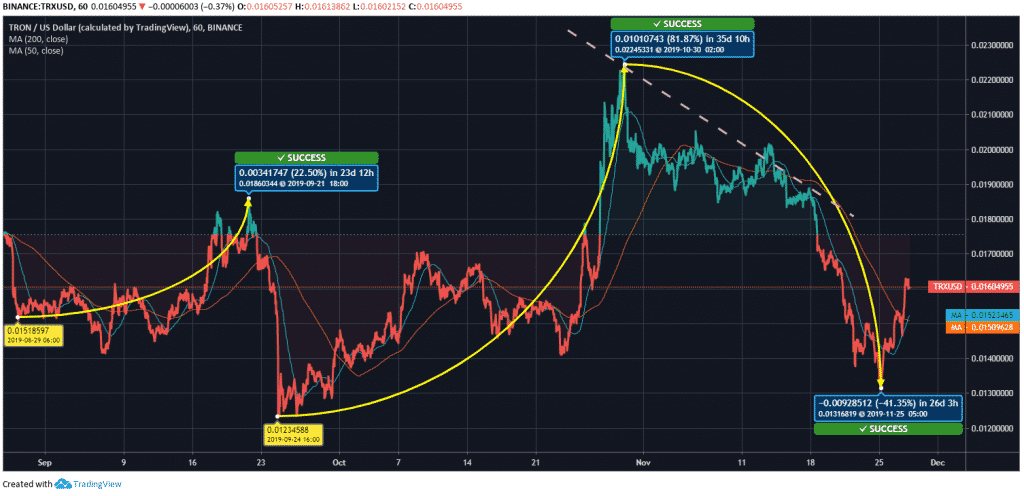
TRX’s last three months’ price movement pattern has been full of fluctuations and despite this volatility, Tron has gained 5.68% over the last 90 days. Tron has been through three major price variations in this period in the range between 0.0123 USD and 0.0224 USD.
Tron Price Prediction
TRX price was being traded at 0.0151 USD on August 29 and over the next 23 days, it gained 22.5% to reach 0.0186 USD. It was followed by another increment in the price between September 24 & October 30, and in these 35 days; Tron added 0.0101 USD and got placed at 0.02245331 USD, the highest in the last 90 days. It was followed by a slump in the value over the next 26 days that took the Tron price to 0.0131 USD by November 25.
Tron’s market cap on August 29 was 1.035 billion USD and over the last 90 days, it has been increased to 1.075 billion USD. The market cap also has been through tremendous pressure in the last 90 days.
Tron’s 200-days MA stands at 0.01509628 USD and its 50-days MA is at 0.01523465 USD. The current price of TRX coin is at 0.01604955 USD that is 5.34% and 6.31% more than the 50-days and 200-days moving averages, respectively. Tron’s next halt may come at the resistance of 0.0168 USD.
| Tron (TRX) | Resistance and Support Levels |
| 1st Resistance | $0.016807667 |
| 2nd Resistance | $0.017466333 |
| 3rd Resistance | $0.018534667 |
| 1st Support | $0.015080667 |
| 2nd Support | $0.014012333 |
| 3rd Support | $0.013353667 |
Leave a Reply